
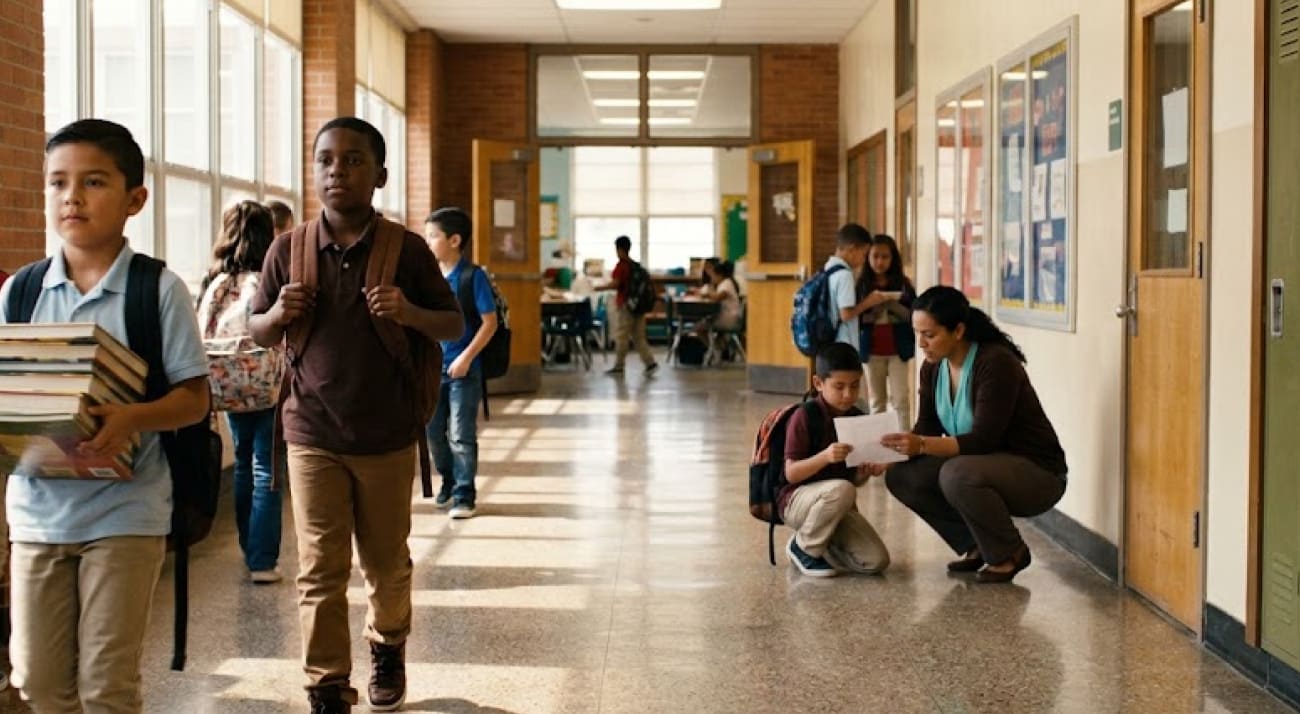
Pershing Elementary School in San Antonio has delivered one of the most striking academic turnarounds in the area after moving from an F rating to a B in one year, earning an overall 89 out of 100 in the Texas Education Agency’s 2026 accountability system. The improvement represents the largest one-year score increase among San Antonio-area schools and leaves the campus just one point below an A.
The result is especially notable because Pershing serves a student population facing significant economic and language barriers. The Texas Education Agency’s 2026 campus data list 309 students, with 98.7% classified as economically disadvantaged and 46.6% identified as English learners. For families following Texas student success, the story offers a useful example of how school leadership, classroom strategy and consistent progress monitoring can translate into measurable academic gains.
A One-Year Turnaround Built Around Instruction
The jump from F to B did not come from a single intervention or a change in the student population. Pershing Principal Shelene Livas and her staff spent the year focusing on specific instructional practices intended to identify problems earlier and respond to them more consistently.
Among the strategies was subject-specialized teaching in upper grades, allowing teachers to concentrate more deeply on particular academic areas. Staff members also monitored student progress regularly rather than waiting for end-of-year assessment results to reveal gaps.
That approach changes the role of assessment inside a school.
Instead of viewing test results simply as a final measurement, teachers can use classroom performance and interim data to determine which students need additional instruction. The process creates a feedback loop: students demonstrate what they understand, educators identify weaknesses, instruction changes and progress is measured again.
The 2026 results suggest that Pershing’s approach produced meaningful movement.
The campus received an overall score of 89, compared with its previous F rating. TEA’s official 2026 comparison report shows Pershing with an 89 overall score and B rating, while its individual domains included a 62/D in Student Achievement, 91/A in School Progress, 91/A in Relative Performance, 70/C in Closing the Gaps and an overall B rating.
That combination is important because it reveals that the turnaround is driven particularly strongly by progress rather than uniformly high achievement across every measure.
The Texas Education Agency accountability system provides the framework for understanding those separate components.
The Numbers Behind Pershing’s Improvement
The 89-point overall score tells only part of the story.
Texas’ A-F accountability system combines multiple academic measures, and TEA publishes separate information for Student Achievement, School Progress and Closing the Gaps. The 2026 accountability materials also include comparison groups and other indicators that help put individual campus performance into context.
For Pershing, the difference between Student Achievement and School Progress is particularly revealing.
| Pershing Elementary 2026 Measure | Score | Rating |
|---|---|---|
| Overall | 89 | B |
| Student Achievement | 62 | D |
| School Progress | 91 | A |
| Relative Performance | 91 | A |
| Closing the Gaps | 70 | C |
| Overall Accountability | 89 | B |
The campus earned its strongest marks in School Progress and Relative Performance, both at 91. Student Achievement remained considerably lower at 62.
That distinction prevents the F-to-B turnaround from being interpreted as a claim that Pershing has solved every academic challenge.
Instead, the data indicate that students made substantial progress while the campus continues to face a gap between growth and absolute achievement levels.
That is a familiar challenge for schools serving large populations of economically disadvantaged students. A student can make significant gains during a school year and still need additional time to reach the state’s highest achievement levels.
The 2026 rating therefore reflects both achievement and trajectory.
Why Student Demographics Matter
Pershing’s student population makes the improvement more significant from an educational-equity perspective.
TEA’s 2026 data show that 98.7% of Pershing students are economically disadvantaged. Nearly half of the campus population—46.6%—is classified as economically disadvantaged in the state’s comparison data, while 31.5% are English learners.
The figures demonstrate why school performance cannot always be separated from the circumstances surrounding students.
Economic disadvantage can affect access to educational resources, technology, tutoring, transportation and other supports outside school. English learners can also require specialized instructional approaches that help students develop language proficiency while learning grade-level content.
Pershing’s results do not eliminate those challenges.
They demonstrate that the presence of those challenges does not make academic improvement impossible.
That distinction is central to the school’s turnaround story.
The campus appears to have focused its resources on instructional consistency rather than attempting to solve every external factor affecting students. Teachers concentrated on classroom performance, student progress and targeted support.
The result was an academic environment where improvement could be tracked rather than assumed.
The Role Of Principal Shelene Livas
Leadership has been a major part of the transformation.
Principal Shelene Livas led Pershing during the turnaround, working with teachers who had experience at the campus and understood the challenges students were facing. The staff included educators such as Mónica Carvente and Jessica Garcia, whose classroom experience became part of the effort to establish stronger instructional practices.
Livas’ role illustrates an important distinction between school reform as a policy initiative and school improvement as a daily process.
A principal can establish expectations, allocate resources and organize professional development, but classroom improvement depends on teachers translating those decisions into instruction.
At Pershing, the emphasis was on making those classroom decisions more consistent.
Teachers monitored individual students, adjusted instruction and created additional opportunities for students to practice skills. The strategy was less about a single dramatic program and more about improving numerous small decisions made throughout the school day.
That approach can be difficult to measure while it is happening.
There may be no obvious moment when a school “turns around.” Instead, the process appears through hundreds of student-level improvements that eventually become visible in assessment data.
Pershing’s 2026 rating provides a measurable indication that those efforts produced results.
Reading Became Part Of The School Environment
One of the more visible strategies at Pershing was an effort to make reading part of the school’s physical environment.

The campus introduced reading nooks in hallways, creating additional opportunities for students to engage with books outside conventional classroom instruction. Staff also incorporated cross-disciplinary academic activities designed to connect different subjects.
The importance of such changes goes beyond decoration.
When literacy becomes part of a school’s daily environment, students encounter reading in more places and contexts. A hallway reading area does not replace structured literacy instruction, but it can reinforce the idea that reading is an ordinary part of school life rather than an activity reserved for a particular class.
Pershing also used reward systems to encourage participation and student engagement.
These strategies are relatively straightforward, but their effectiveness depends on consistency.
A reading corner only becomes useful if students actually use it. A reward system only supports learning if it reinforces meaningful behaviors. Cross-disciplinary activities only improve learning when teachers connect them to clear academic objectives.
The larger lesson from Pershing is therefore not that any one of these tactics caused the turnaround.
It is that the school created multiple points of reinforcement around student engagement and academic progress.
School Progress Outpaced Student Achievement
Pershing’s accountability profile presents an important analytical distinction.
Its 91 School Progress score indicates that the campus performed strongly on measures related to student growth. Yet its 62 Student Achievement score remained in the D range.
That gap suggests that the school is moving in the right direction without having reached its final academic target.
For educators, this can be an encouraging signal.
A school with weak achievement but strong growth may have evidence that its current instructional strategies are working. The next challenge is maintaining that growth long enough for more students to reach higher achievement levels.
For families, however, the distinction is equally important.
A B rating does not mean every student at Pershing is performing at a B-level standard in every subject. The accountability grade summarizes several measures across the campus.
The most useful question is whether students are making sustained progress.
Pershing’s data provide evidence that they are.
The Texas Schools accountability resources allow families and educators to examine those measures rather than relying exclusively on the overall letter grade.
English Learners Add Another Layer To The Challenge
Pershing’s 31.5% English learner population adds another dimension to its academic work.
For these students, academic achievement and language development can overlap. A student may understand a mathematical concept, scientific process or historical event while still developing the English vocabulary necessary to explain that understanding in an assessment.
That makes classroom instruction more complex.
Teachers must provide access to grade-level content while also supporting language development. Reading strategies, vocabulary development and opportunities for students to communicate their thinking become important across multiple subjects.
Pershing’s improvement suggests that the campus has been able to make progress within that environment.
It also explains why sustaining the gains will require more than simply repeating last year’s approach.
Students change. Grade-level expectations increase. New English learners enter the campus. Students who made significant progress in one grade must continue that trajectory in the next.
The school’s next challenge is therefore continuity.
The Turnaround Is Not Finished
The strongest temptation following a dramatic F-to-B turnaround is to treat the story as complete.
The data argue against that interpretation.
Pershing’s 89 overall score is impressive, but the 62 Student Achievement score shows that the campus still has work to do. Its 70 Closing the Gaps score also indicates that performance across student groups remains an area for continued attention.
The immediate goal should be turning one successful year into a sustained pattern.
That requires maintaining the practices that generated growth while identifying where they can be strengthened.
For students, this could mean more targeted reading support, continued monitoring of individual academic progress and additional intervention for learners who remain below grade level.
For teachers, the challenge will be preserving instructional consistency without making the classroom experience overly focused on testing.
For school leadership, the responsibility will be identifying which strategies produced the strongest gains and ensuring those practices become part of the campus culture rather than depending on individual staff members.
What Pershing’s F-To-B Jump Means For San Antonio
Pershing’s transformation also matters beyond the campus itself.
The school is part of San Antonio Independent School District, where the 2026 accountability results provide a broader picture of academic performance across a diverse urban student population.
A turnaround of this magnitude gives district leaders a case study that can be examined for transferable practices.
The question is not whether another school can simply copy Pershing’s approach.
The more useful question is which elements are adaptable.
Regular student progress monitoring, subject specialization, stronger reading environments and consistent teacher collaboration can potentially be used elsewhere. But each campus has different enrollment patterns, staffing conditions and student needs.
The San Antonio ISD school information provides families with additional context about the district and its campuses.
Pershing’s results also reinforce a broader point about accountability ratings: improvement should be evaluated through multiple years of evidence.
One strong year is meaningful.
Two or three consecutive years of growth would provide stronger evidence that the instructional changes have become sustainable.
The Next Goal Is An A
Pershing finished the 2026 accountability cycle with an 89, only one point below an A.
That creates a clear target for the school, but the pursuit of an A should not become the only measure of success.
The more important task is continuing the academic growth that produced the 89 in the first place.
If the campus can raise Student Achievement while maintaining its 91 School Progress score, the overall profile could become considerably stronger. Improving Closing the Gaps performance would also make the gains more broadly distributed across the student population.
For the approximately 300 children attending Pershing, those numbers translate into something much more tangible than an accountability report.
They represent stronger reading skills, better academic foundations and more confidence that the work done inside classrooms can change a student’s trajectory.
The F-to-B jump is therefore best understood as a milestone rather than an endpoint.
Pershing Elementary has demonstrated that a campus with substantial economic and language challenges can produce major academic gains in a single school year. The next measure of the turnaround will be whether the school can preserve that momentum, raise achievement levels and turn an exceptional one-year improvement into a lasting culture of student success.